The Real Cost of Waiting
A $550,000 insurance claim for an accident that wasn't your fault. That was the breaking point for Lansberry Trucking. Not hypothetical. Not probable. A single incident that forced leadership to ask the hardest question any fleet operator faces: what are the hidden costs of not having video evidence?
For most fleet managers, the ROI math feels backward. You see the camera hardware price. You see the monthly subscription. You don't immediately see the savings. But they're there, hiding inside claims you'll never file, accidents you'll prevent, and hours your safety director won't spend hunting for footage.
This guide walks through the ROI model that actually works, using verified data from commercial fleets that made the switch. You'll learn the five cost categories that matter most, build a scenario custom to your fleet size, and put hard numbers in front of your leadership team.
The Five Cost Categories That Drive ROI
Claims Avoided and Expedited
The biggest money sits here. When a collision happens, video evidence moves a claim from "he said, she said" to "closed in 48 hours."
Lansberry Trucking cut claims losses by 80% in one year after deploying network-connected cameras across their 80-truck fleet. Sam Lansberry II, the founder, reframed the investment entirely: "I don't view our investment in SureCam as a cost, it's a profit-center. Last year alone, our claims losses reduced by over 80%."
That 80% drop didn't come from fewer accidents (though those happened too). It came from speed. Network-connected cameras upload footage in real-time. When an incident occurs, your team has video within minutes. Insurance partners can process the claim faster. Third-party liability disputes resolve before legal costs spiral.
The math: average commercial auto claim = $8,000-$15,000. A typical 30-vehicle fleet might experience 2-3 preventable third-party claims per year without video evidence. With video, false claims drop 75-100%. Conservative estimate: $30,000-$45,000 saved annually from claims avoidance alone.
Accident Frequency Reduction
Fewer accidents fundamentally lower insurance premiums. Network-connected cameras with real-time alerts create a feedback loop: drivers know incidents trigger instant notification. Behavior changes. Collisions decrease.
Krispy Kreme UK achieved an 80% drop in incident and accident frequency after deploying forward-facing cameras across their national UK delivery fleet. That wasn't just fewer crashes to fight. That meant fewer repair bills, fewer days off the road, fewer injury claims rippling into workers' comp.
The insurance impact shows up twice. First: you reduce actual claims. Second: insurers reduce your premium because your loss history improves. A fleet moving from "high-risk" to "managed risk" status can see 10-20% premium reductions after 12 months of solid data.
For a 50-vehicle fleet with average annual insurance costs of $200,000, a 15% reduction nets $30,000 per year in premium savings alone.
Administrative Time and Labor
Before video telematics, claims investigation meant paperwork. Lots of it.
Concrete Strategies, a national concrete supplier, documented this clearly. Claims that once consumed 8-10 hours each, spread across multiple days, now take 1-2 hours. They cut claims administration from roughly one week per month (40 hours) to under 10 hours monthly. That's 30 hours freed up per month, or 360 hours per year.
At $35 per hour (safety/operations coordinator wage), that's $12,600 in recovered labor annually for a mid-sized fleet. For larger operations, the time savings scale quickly.
Add in the hours normally spent on driver interviews, police report reviews, photo analysis, and insurance adjuster follow-ups. Video eliminates most of that work.
Fuel Efficiency and Idle Reduction
Telematics-connected dash cameras supply real-time data on driver behavior: speeding, harsh braking, and excessive idling. When drivers know they're being watched, fuel consumption drops.
euroloo, a UK utility services fleet of 65+ vehicles, cut idling fuel consumption by 22% after integrating SureCam cameras with their Geotab telematics system. For a typical service fleet burning 15,000 gallons per year, a 22% idle reduction saves roughly 3,300 gallons. At current fuel prices ($3.50/gallon), that's $11,550 per year.
Fuel efficiency gains vary by operation type (local delivery fleets see bigger gains than long-haul), but most fleets report 10-15% fuel savings within 6 months of deployment.
Training and Driver Retention
Turnover costs money. A 50-vehicle fleet with 30% annual turnover replaces 15 drivers per year. Recruiting, hiring, onboarding, and lost productivity from new driver ramp-up typically costs $8,000-$12,000 per driver. That's $120,000-$180,000 per year in turnover costs alone.
Video telematics reduce turnover by supporting drivers and holding them accountable fairly. When drivers know video will exonerate them in false claims, they trust the company more. When coaching uses video to teach, not punish, drivers improve and feel supported.
Maneri Traffic Control, a California traffic control company, reported a 70% increase in team productivity and better retention alongside their video deployment. While the causation runs through multiple factors, the net effect appeared in their bottom line.
A conservative estimate: reducing turnover by 5-10% saves $6,000-$18,000 per year on a 50-vehicle fleet.
Build Your Scenario: Sample Fleet Models
These three scenarios use industry averages and verified case study data. Adjust the variables for your operation.
10-Vehicle Service Fleet
Annual estimates:
- Claims avoidance: $6,000 (1 prevented claim @ ~$6K)
- Accident frequency reduction: $5,000 (lower premiums on 10% of policy)
- Admin time: $2,500 (25 hours saved per year)
- Fuel/idle: $1,800 (12% idle reduction)
- Turnover reduction: $2,000
- Total annual benefit: $17,300
Hardware (leased): $80/vehicle/month = $9,600/year Software: $50/vehicle/month = $6,000/year Total annual cost: $15,600
Net annual savings: $1,700 Payback period: 8-9 months
Breakeven comes in month 9. Year two and beyond, the fleet gains the full $17,300 annually.
50-Vehicle Mixed Fleet
Annual estimates:
- Claims avoidance: $40,000 (3-4 prevented claims)
- Accident reduction/insurance: $30,000 (15% reduction on $200K annual policy)
- Admin time: $12,600 (360 hours saved)
- Fuel/idle: $9,000 (15% idle reduction, 20K gallons/year)
- Turnover reduction: $12,000 (5% reduction in 40% turnover baseline)
- Total annual benefit: $103,600
Hardware (leased): $80/vehicle/month = $48,000/year Software: $40/vehicle/month = $24,000/year Total annual cost: $72,000
Net annual savings: $31,600 Payback period: 8-9 months
150-Vehicle Enterprise Fleet
Annual estimates:
- Claims avoidance: $90,000 (6-8 prevented claims @ higher severity)
- Accident reduction/insurance: $90,000 (15% reduction on $600K policy)
- Admin time: $30,000 (960 hours saved @ safety staff time)
- Fuel/idle: $27,000 (telematics integration)
- Turnover reduction: $36,000 (8% reduction in turnover)
- Maintenance and uptime gains: $25,000 (predictive alerts prevent breakdowns)
- Total annual benefit: $298,000
Hardware (leased): $70/vehicle/month = $126,000/year Software: $35/vehicle/month = $63,000/year Total annual cost: $189,000
Net annual savings: $109,000 Payback period: 7-8 months
As fleet size grows, per-unit costs drop and benefit density increases. Larger fleets see faster payback.
How Insurance Premium Reduction Actually Works
Insurance carriers monitor three metrics: loss history, frequency, and severity. Video telematics improves all three.
Loss history: when claims resolve faster and third-party disputes drop, your historical loss ratio improves. That's the strongest signal an insurer sees.
Frequency: fewer collisions, fewer claims. Some insurers cut 5-10% off premiums after seeing one year of incident data from connected cameras.
Severity: video proves liability faster, reducing payout amounts on third-party claims.
Tier this in your ROI model conservatively. Most fleets see meaningful premium reductions (10-15%) in year 2, after 12 months of safety data prove the system works. Some insurers offer 5-10% discounts in year 1 as an incentive.
Ask your broker to model your current premium against a scenario with 15% fewer claims and improved loss control. That number becomes part of your ROI case. SureCam can work with your broker to validate these numbers.
Hidden Savings You Rarely See Calculated
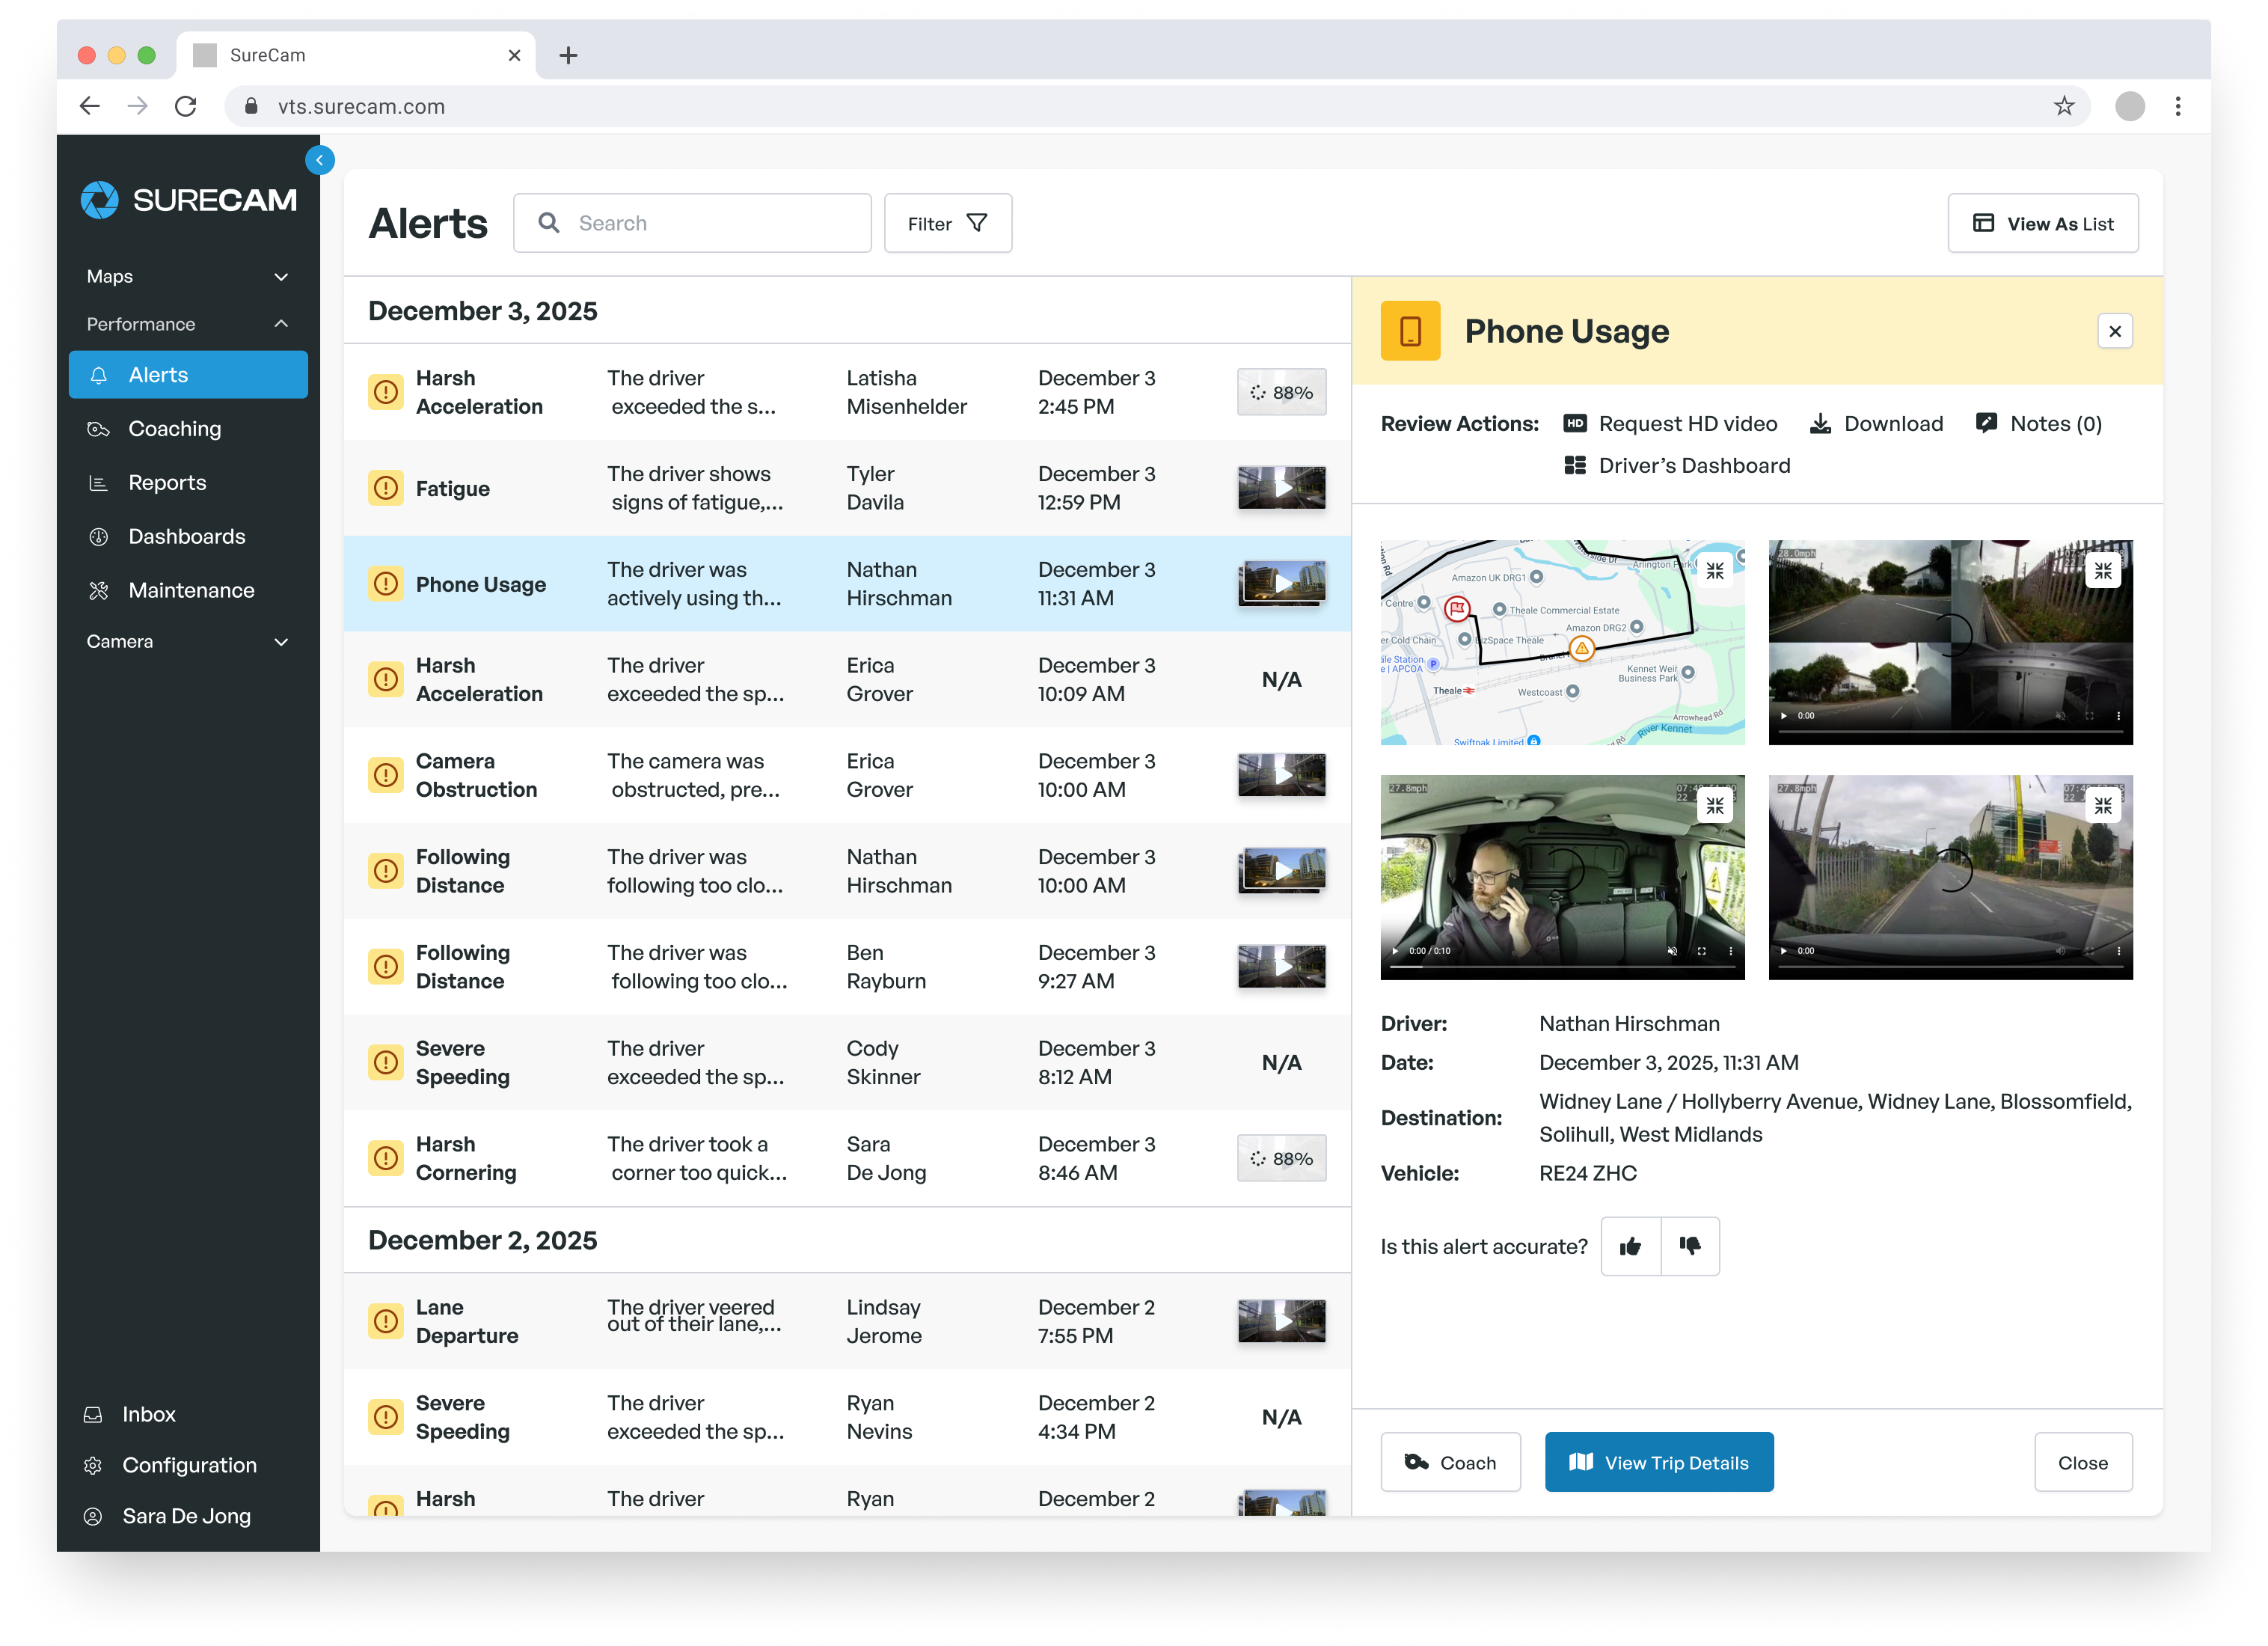
Driver coaching reduces accident severity. Lansberry's safety director reviews all fleet footage in 15-20 minutes per day, spot-checking for coaching opportunities. When drivers see their harsh braking and close-following events, they change. Fewer accidents multiply into lower workers' comp claims.
Operational compliance becomes visible. You know which drivers are speeding in school zones, which are backing without spotting, and which are texting. You prevent violations before they happen.
Fleet utilization improves. Real-time GPS layered with video lets dispatchers confirm drivers are where they say they are, doing what they should be doing. Route optimization, customer service response time, and utilization all lift.
Litigation defense sharpens. When a customer claims a driver was reckless, the video shows what actually happened. False allegations disappear. Real misconduct becomes a coached improvement rather than a liability spiral.
None of these show up as line items on insurance bills, but they reduce operational friction, lower risk exposure, and free management bandwidth to focus on growth instead of firefighting.
Building Your Business Case for Leadership
Start with the question your CFO is already asking: Will this pay for itself?
The answer, based on verified fleet data, is yes. Most commercial fleets see payback within 8-10 months. Year one breaks even or shows a modest profit. Year two and beyond deliver full annual benefit.
Frame it as Sam Lansberry II did: a profit center, not a cost center. Show the claims data from your industry and your own loss history. Model the insurance impact conservatively (assume 10% year-one discount, 15% year-two discount). Build in the admin time savings with actual hourly rates from your safety coordinator's salary.
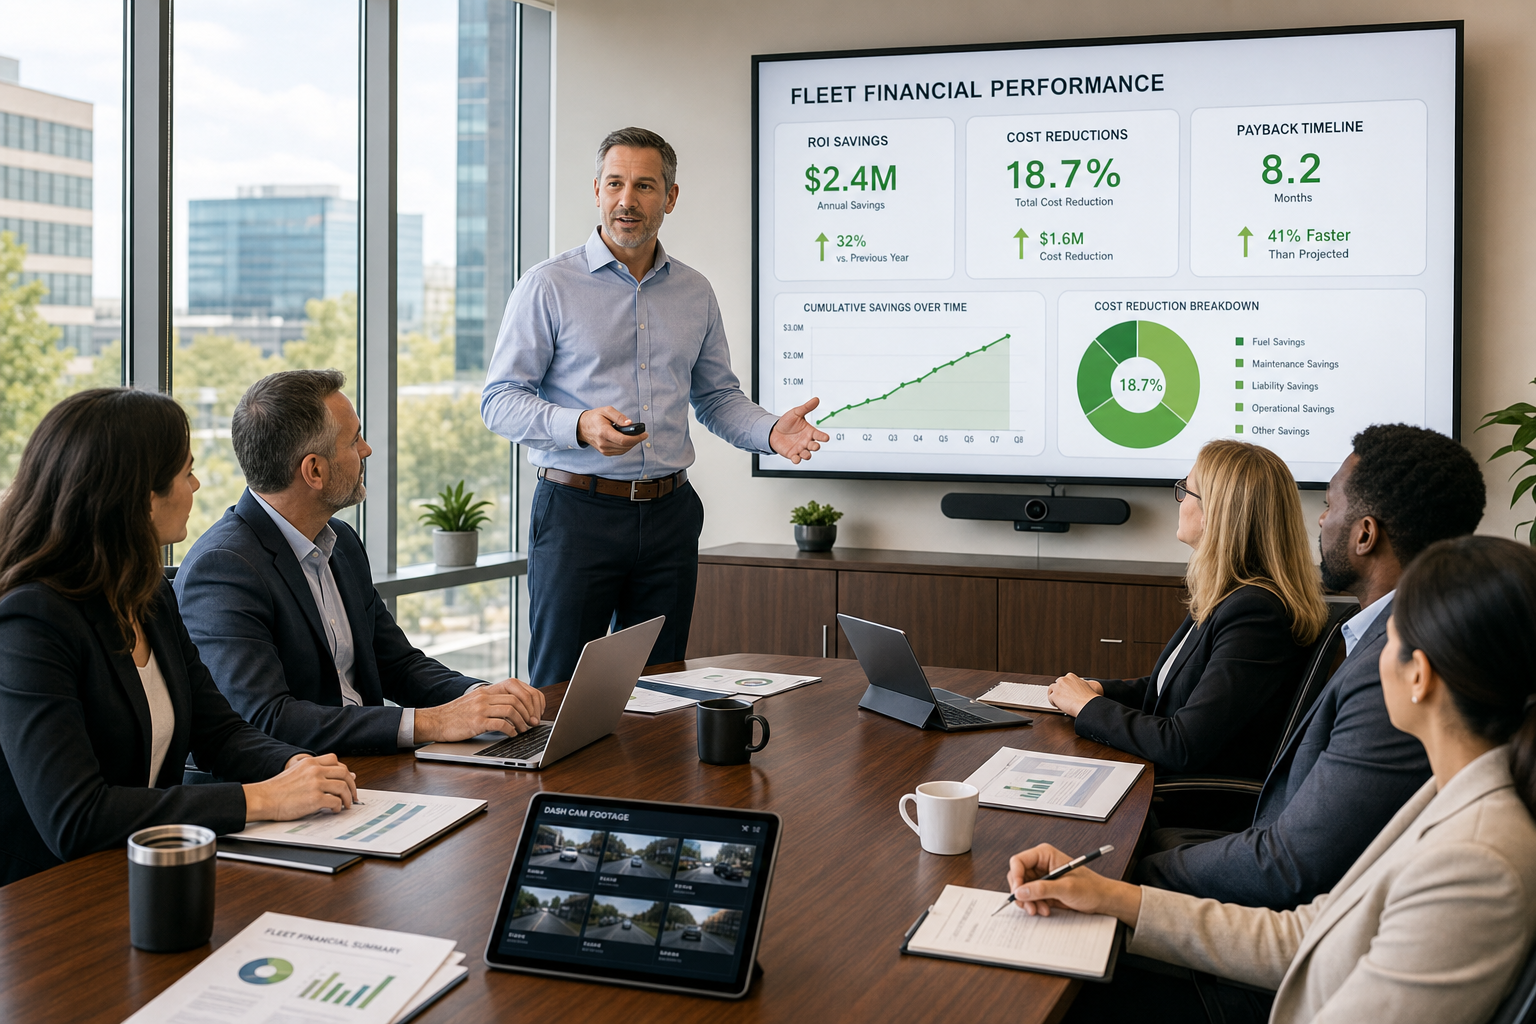
Your leadership wants to see three numbers:
- Total investment (hardware + software for year one)
- Documented annual benefit (sum of all five categories)
- Payback timeline (months to break even)
Everything else is context. Lead with payback.
Comparing Vendor Payback Periods
Not all connected camera systems deliver the same ROI. SD-card systems require manual footage retrieval, delaying claims investigations. Fully-managed services charge premium fees for video review that your team could do with a simple platform.
Network-connected systems with self-managed software platforms deliver the fastest payback. Real-time upload means claims move faster. Simple web interfaces mean your team doesn't need external analysts. You control the time investment.
When evaluating vendors, ask each one: "How many days does a typical claims investigation take from incident to claim submission?" That single metric correlates almost directly with ROI payback.
The Bottom Line
Fleet dash cam ROI isn't speculative. It rests on verified outcomes from hundreds of commercial fleets. Lansberry's 80% claims reduction. Krispy Kreme's 40% insurance savings. euroloo's 22% fuel efficiency gain. These aren't anomalies. They're repeatable.
Your payback timeline depends on your fleet size, loss history, and operational focus. Small fleets see payback in 8-10 months. Larger fleets see it in 7-8 months. Year two delivers compounding benefit with no hardware replacement costs.
Build your scenario using the categories above. Get quotes from vendors who focus on speed, transparency, and simplicity. Model the insurance benefit with your broker. Then show your leadership team the numbers.
The investment pays for itself. Everything after that is profit.